
Wellington Florida 2023 Real Estate Market Recap
Wellington Florida has been experiencing an extreme seller's market for several years, but did that trend continue in 2023? Yes, even though mortgage interest rates were at an all-time high Wellington remains a sellers market due in part to the lack of home inventory.
Lack of Home Inventory
Since 2015 Wellington has consistently been a strong sellers, which eventually turned into an extreme seller's market throughout 2020, 2021, and even 2022. While home inventory has risen throughout 2023 the lack of inventory has kept it a sellers market.
In a "normal" sellers market Wellington usually had 550-600 properties for sale and by March of 2022 we only had 141 properties for sale, a record low. However, as mortgage interest rates climbed so did the home inventory but it still remains at an all-time low. So even though home inventory has increased and decreased throughout 2023 it has never exceeded 340 homes for sale, which means there is a long way to go before Wellington becomes a buyer's market or even a stable market.
Did the Median Sales Price Increase or Decrease?
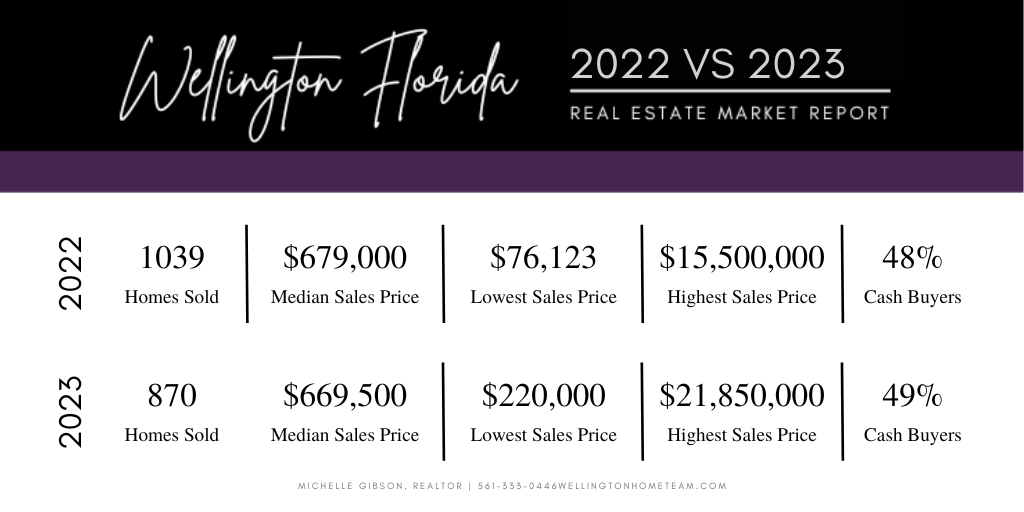
Over 900 million dollars worth of real estate was sold in 2023. While it's less than the $1.1 billion that sold in 2022 it's more than the $875 million that sold in 2020.
The median sales price in Wellington went from $679,000 in 2022 to $669,500, that's a 1.4% increase. However, many neighborhoods throughout Wellington saw an increase in property value.
Were Cash Buyers King?
Cash buyers have been very prominent in the Wellington real estate market for years and 2023 was no different. Roughly 48% of home buyers paid cash in 2022 and 49% paid cash in 2023, which is no surprise.
Cash homebuyers were responsible for both the minimum and maximum sales recorded in 2023. The highest sale was $21,850,000 for an incredible horse farm. While the lowest sale was $220,000 for 2 bedroom and 2 bathroom villa.
Month
Homes for Sale
Homes Sold
$ Per Sq Ft
DOM
January
262
$299,000 to $31M
55
$300,000 to $3,295,000
December 2022 Sales
$293
54
Febuary
273
$299,000 to $31,000,000
Homes for Sale
38
$357,000 to $6,500,000
January 2023 Sales
$264
Price Per Sq Ft
43
Days on Market
March
258
$299,000 to $31,000,000
Homes for Sale
62
$275,000 to $3,075,000
February 2023 Sales
$287
Price Per Sq Ft
43
Days on Market
April
256
$299,000 to $31M
Homes for Sale
83
$300,000 to $9,149,550
March 2023 Sales
$286
Price Per Sq Ft
32
Days on Market
May
234
$309,995 to $31M
Homes for Sale
74
$280,000 to $3,980,000
April 2023 Sales
$312
Price Per Sq Ft
16
Days on Market
June
240
$320,000 to $31M
Homes for Sale
107
$275,000 to $21,675,000
May 2023 Sales
$341
Price Per Sq Ft
23
Days on Market
July
256
$295,000 to $28M
Homes for Sale
104
$325,000 to $12,200,000
June 2023 Sales
$302
Price Per Sq Ft
13
Days on Market
August
234
$275,000 to $28M
Homes for Sale
73
$220,000 to $21,850,000
July 2023 Sales
$295
Price Per Sq Ft
14
Days on Market
September
267
$250,000 to $27,750,000
Homes for Sale
72
$275,000 to $8,850,000
August 2023 Sales
$313
Price Per Sq Ft
24
Days on Market
October
296
$250,000 to $27,750,000
Homes for Sale
55
$270,000 to $1,912,500
September 2023 Sales
$288
Price Per Sq Ft
27
Days on Market
November
329
$284,900 to $27,750,000
Homes for Sale
67
$263,000 to $8,000,000
October 2023 Sales
$323
Price Per Sq Ft
22
Days on Market
December
329
$284,900 to $27,750,000
Homes for Sale
61
$312,000 to $10,900,000
November 2023 Sales
$302
Price Per Sq Ft
20
Days on Market
January
337
$299,000 to $27,750,000
Homes for Sale
60
$285,000 to $17,300,000
December 2023 Sales
$310
Price Per Sq Ft
23
Days on Market
Information provided by Beaches MLS deemed reliable, but not guaranteed
Detailed Monthly 2023 Real Estate Market Recaps
Wellington Florida Real Estate Market Report | January 2023
The Wellington Florida real estate market remains a strong sellers market as we enter 2023!
Home inventory slightly increased, which is the norm for this time of year. Last month we had 250 homes for sale with asking prices ranging from $290,000 to $32,000,000. Now we have 262 homes for sale with asking prices ranging from $299,000 to $31,000,000.
Home sales have also increased! Back in November 47 homes sold with sale prices ranging from $297,000 to $12,250,000. While in December 55 homes sold with sale prices ranging from $300,000 to $3,295,000.
The average DOM (Days on Market) increased from 38 days in November to 54 days in December. While the price per square foot also increased from $290 in November to $293 in December. Just like in October and November, there were no distressed sales (bank-owned or short-sale).
The number of wellington cash buyers has decreased from 49% in November down to 42% in December. Conventionally financed buyers went from 47% in November to 51% in December. FHA homebuyers accounted for 2% in November and went back down to 0% in December. VA homebuyers went from 0% down to 4% and other sales went from 2% up to 3% in December
Wellington Florida Real Estate Market Report | February 2023
The Wellington Florida real estate slowed down throughout the holiday season into the new year. However, the market is starting to heat back up.
Last month we had 262 homes for sale with asking prices ranging from $299,000 to $31,000,000. Now we have 273 homes for sale but the asking prices remain the same.
Home sales in January decreased, which is the norm. Back in December 55 homes sold with sale prices ranging from $300,000 to $3,295,000. While only 38 homes sold in January with sale prices ranging from $357,000 to $6,500,000.
The average DOM (Days on Market) decreased from 54 days in December down to 43 days in January. While the price per square foot decreased from $293 in December down to $263 in January. Just like the previous months, there were no distressed sales (bank-owned or short-sale).
The number of Wellington cash buyers has increased from 42% in December to 45% in January. Conventionally financed buyers went from 51% in December up to 53% in January. FHA homebuyers accounted for 0% of home sales in December and increased to 2% in January. VA homebuyers and other sales accounted for 0% of sales in January.
Wellington Florida Real Estate Market Report | March 2023
With home inventory decreasing and home sales increasing the Wellington Florida real estate is heating up again!
Last month we had 273 homes for sale with asking prices ranging from $299,000 to $31,000,000. Now we have 258 homes for sale but the asking prices remain the same for the second month in a row.
Home sales increased 63%! Back in January only 38 homes sold with sale prices ranging from $357,000 to $6,500,000. While in February, 62 homes sold with sale prices ranging from $275,000 to $3,075,000.
The average DOM (Days on Market) remained the same at 43 days for both January and February. While the price per square foot increased from $263 in January up to $287 in February. Just like the previous months, there were no distressed sales (bank-owned or short-sale).
The number of Wellington cash buyers has increased from 45% in January up to 55% in February. Conventionally financed buyers went from 53% in January down to 36% in February. FHA homebuyers accounted for 2% of the home sales in January and increased to 5% in February. VA homebuyers and other sales accounted for 0% of sales in January and increased to 4% in February.
Wellington Florida Real Estate Market Report | April 2023
Home inventory in Wellington Florida has slightly decreased while the number of home sales increased!
Last month we had 258 homes for sale with asking prices ranging from $299,000 to $31,000,000. Now we have 256 homes for sale but the asking prices remain the same for the third month in a row.
Back in February, 62 homes sold with sale prices ranging from $275,000 to $3,075,000. While in March 83 homes sold with sale prices ranging from $300,000 to $9,149,550.
The average DOM (Days on Market) decreased from 43 in February down to 32 in March. While the price per square foot slightly decreased from $287 in February down to $286 in March. While there have been no distressed sales (bank-owned or short-sale) for a long period of time there were 2 bank-owned home sales in March.
The number of Wellington cash buyers has decreased from 55% in February down to 47% in March. Conventionally financed buyers went from 36% in February up to 47% in March. FHA homebuyers accounted for 5% in February down to 1% in March. VA homebuyers and other sales accounted for 4% in February and went up to 5% in March.
Wellington Florida Real Estate Market Report | May 2023
Home inventory in Wellington Florida has decreased again.
Last month we had 256 homes for sale with asking prices ranging from $299,000 to $31,000,000. Now we only have 234 homes for sale with asking prices ranging from $309,995 to $31,000,000.
Back in March, 83 homes sold with sale prices ranging from $300,000 to $9,149,550. While in April 74 homes sold with sale prices ranging from $280,000 to $3,980,000.
The average DOM (Days on Market) decreased from 32 in March down to only 16 days in April. While the price per square foot has increased from $286 in March up to $312 in April. While there have been no distressed sales (bank-owned or short-sale) for a long period of time there were 2 bank-owned home sales in March and only 1 bank-owned home sale in April.
The number of Wellington cash buyers for March and April remains the same at 47%. Conventionally financed buyers went from 47% in March down to 45% in April. FHA homebuyers accounted for 1% in March and went up to 3% in April. VA homebuyers and other sales accounted for 5% in both March and April.
Wellington Florida Real Estate Market Report | June 2023
Home inventory in Wellington Florida has increased but so have home sales! Last month we had 234 homes for sale with asking prices ranging from $309,995 to $31,000,000. Now we have 240 homes for sale with asking prices ranging from $320,000 to $31,000,000.
Back in April 74 homes sold with sale prices ranging from $280,000 to $3,980,000. While in May 107 homes sold with sale prices ranging from $275,000 to $21,675,000.
The average DOM (Days on Market) increased from 16 days in April up to 23 days in May. While the price per square foot has increased again from $312 in April to $341 in May. Back in April 1 bank-owned home sold while in May there were no distressed sales.
The number of Wellington cash buyers for April was 47% and in May increased to 58%. Conventionally financed buyers went from 45% in April down to 36% in May. FHA homebuyers accounted for 3% in both April and May. VA homebuyers and other sales accounted for 5% in April down to 3% in May.
Wellington Florida Real Estate Market Report | July 2023
Home inventory in Wellington Florida has slightly increased while sales have slightly decreased. Last month we had 240 homes for sale with asking prices ranging from $320,000 to $31,000,000. Now we have 256 homes for sale with asking prices ranging from $295,000 to $28,000,000.
Back in May 107 homes sold with sale prices ranging from $275,000 to $21,675,000. While in June 104 homes sold with sale prices ranging from $325,000 to $12,200,000.
The average DOM (Days on Market) decreased from 23 days in May down to 13 days in June. While the price per square foot has decreased from $341 in May down to $302 in June. Back in May there were no distressed sales but in June there were 2, one short sale and 1 bank-owned home.
The number of Wellington cash buyers for May was 58% and decreased down to 47% in June. Conventionally financed buyers went from 36% in May up to 46% in June. FHA homebuyers accounted for 3% in May and 5% in June. While VA homebuyers and other sales accounted for 3% in May down to 2% in June.
Wellington Florida Real Estate Market Report | August 2023
Home inventory in Wellington Florida along with home sales has slightly decreased. Last month we had 256 homes for sale with asking prices ranging from $295,000 to $28,000,000. Now we have only 234 homes for sale with asking prices ranging from $275,000 up to $28,000,000.
Back in June 104 homes sold with sale prices ranging from $325,000 to $12,200,000. While in July 73 homes sold with sale prices ranging from $220,000 to $21,850,000.
The average DOM (Days on Market) increased from 13 days in June up to 14 days in July. While the price per square foot has decreased from $302 in June down to $295 in July. Back in June, there were 2 distressed sales, one short sale, and 1 bank-owned home. While there was only 1 distressed sale in July and it was a short sale.
The number of Wellington cash buyers for June was 47% and increased up to 55% in July. Conventionally financed buyers went from 46% in June down to 39% in July. FHA homebuyers accounted for 5% in June and only 3% in July. While VA homebuyers and other sales accounted for 2% in June and 3% in July.
Wellington Florida Real Estate Market Report | September 2023
Home inventory in Wellington Florida has slightly increased but the number of homes remains less than 270. Last month we had 234 homes for sale with asking prices ranging from $275,000 up to $28,000,000. Now we have 267 homes for sale with prices ranging from $250,000 to $27,750,000.
Back in July 73 homes sold with sale prices ranging from $220,000 to $21,850,000. While in August 72 homes sold with sale prices ranging from $275,000 to $8,850,000.
The average DOM (Days on Market) increased from 14 days in July up to 24 days in August. While the price per square foot has increased from $295 in July up to $313 in August. Back in July, there was only 1 distressed sale, it was a short sale and there were zero distressed sales in August.
The number of Wellington cash buyers in July was 55%, which decreased down to 46% in August. Conventionally financed buyers went from 39% in July up to 47% in August. FHA homebuyers accounted for 3% in July and 4% in August. While VA homebuyers and other sales accounted for 3% in July and August.
Wellington Florida Real Estate Market Report | October 2023
Home inventory in Wellington Florida has slightly increased once again but the number of homes for sale is still less than 300. Last month we had 267 homes for sale with prices ranging from $250,000 to $27,750,000. Now we have 296 homes for sale with asking prices ranging from $250,000 to $27,750,000.
Back in August 72 homes sold with sale prices ranging from $275,000 to $8,850,000. While in September 55 homes sold with sale prices ranging from $270,000 to $1,912,500.
The average DOM (Days on Market) increased from 24 days in August up to 27 days in September. While the price per square foot has slightly decreased from $313 in August down to $288 in September. Back in August, there were zero distressed sales and there were no distressed sales in September either.
The number of Wellington cash buyers in August was 46% and in September it decreased to 40%. Conventionally financed buyers went from 47% in August down to 44% in September. FHA homebuyers accounted for 4% in August and that number remained the same in September. While VA homebuyers and other sales accounted for 3% in August has increased to 12% in September.
Wellington Florida Real Estate Market Report | November 2023
Home inventory in Wellington Florida has increased once again but we still have a shortage of inventory. Last month we had 296 homes for sale with asking prices ranging from $250,000 to $27,750,000. Now we have 329 homes for sale with asking prices ranging from $284,900 to $27,750,000.
Back in September 55 homes sold with sale prices ranging from $270,000 to $1,912,500. While in October we had 67 homes for sale with sale prices ranging from $263,000 to $8,000,000.
The average DOM (Days on Market) went from 27 days in September to 22 days in October. While the price per square foot has slightly increased from $288 in September up to $323 in October. Back in September, there were zero distressed sales and there were no distressed sales in October either.
The number of Wellington cash buyers in September was 40% and increased to 55% in October. Conventionally financed buyers went from 44% in September down to 42% in October. FHA homebuyers accounted for 4% in September and decreased to 1% in October. While VA homebuyers and other sales accounted for 12% in September down to 2% in October.
Wellington Florida Real Estate Market Report | December 2023
Home inventory in Wellington Florida hasn't changed since last month nor have the asking prices. The number of homes for sale remains at 329 with asking prices ranging from $284,900 to $27,750,000.
Back in October, a total of 67 homes sold with sale prices ranging from $263,000 to $8,000,000. While in November, 61 homes sold with sale prices ranging from $312,000 to $10,900,000.
The average DOM (Days on Market) went from 22 days in October down to 20 days in November. While the price per square foot has decreased from $323 in October down to $302 in November. Back in October, there were zero distressed sales and there were no distressed sales in November either.
The number of Wellington cash buyers in October was 55% and increased to 48% in November. Conventionally financed buyers went from 42% in October up to 44% in November. FHA homebuyers accounted for 1% in October and decreased to 5% in November. While VA homebuyers and other sales accounted for 2% in October up to 3% in November.
Wellington Florida Homes for Sale

Contact Realtor Michelle Gibson @ 561-333-0446 or Contact@WellingtonHomeTeam.com for all your Wellington Florida Real Estate needs.