

Wellington Florida 2024 Real Estate Market Recap
Wellington Florida was an extreme seller's market for several years, but did that trend continue in 2024? No, while the Village of Wellington began the year as a seller's market, the dynamics gradually shifted, and by the end of the year, it evolved into a more balanced and stable market.
Home Inventory
Home inventory steadily increased throughout 2024, rising by approximately 41%. At the start of the year, there were 337 homes for sale, which grew to 475 by year-end. For perspective, in January 2020, prior to COVID-19, there were 546 homes on the market. By contrast, March 2022 saw an all-time low of just 131 homes. While a 41% increase is significant, 475 homes on the market is still within a reasonable range historically.
Did the Median Sales Price Increase or Decrease?
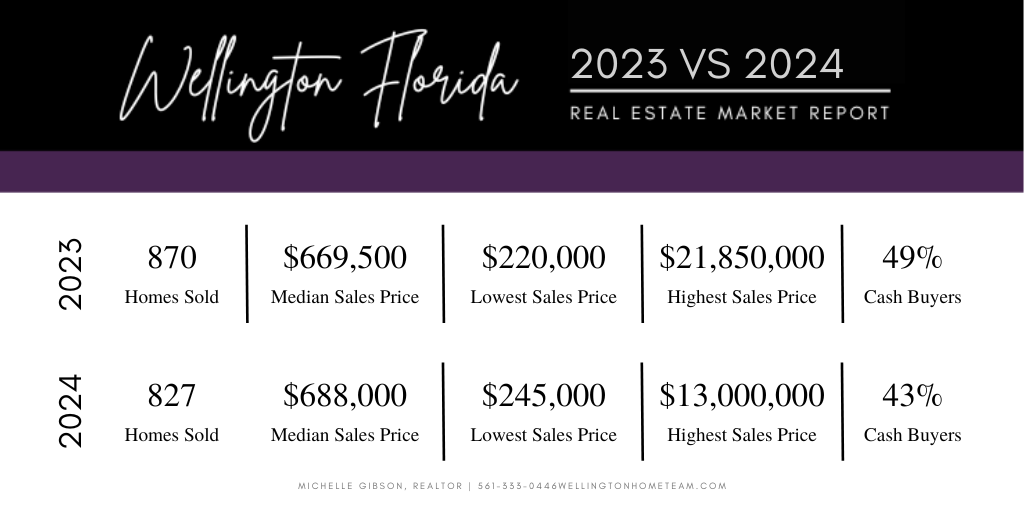
In 2024, just under $860 million worth of real estate was sold in Wellington, reflecting a slight decrease compared to $900 million in 2023.
Despite this, the median sales price in Wellington rose from $669,500 in 2023 to $688,000 in 2024—a 2.8% increase, outperforming the 1.4% increase seen in 2023. However, it's important to note that many neighborhoods in Wellington experienced a decline in property values during the year. With an increase in home inventory buyers had a lots of options to choose from and often were able to negotiate the price down especially if the seller was motivated and had to move.
Were Cash Buyers King?
Cash buyers have long played a significant role in the Wellington real estate market, and 2024 was no exception. Approximately 43% of homebuyers paid cash in 2024, compared to 49% in 2023. While this marks a slight decrease, 43% still represents a substantial portion of the market.
Cash buyers were also behind both the highest and lowest sales in 2024. The highest sale was an impressive $13,000,000 for a stunning horse farm, while the lowest sale was $245,000 for a one-bedroom, one-bathroom condo with a one-car garage.
Month
Homes for Sale
Homes Sold
$ Per Sq Ft
DOM
January
337
$299,000 to $27,750,000
Homes for Sale
60
$285,000 to $17,300,000
December 2023 Sales
$310
Price Per Sq Ft
23
Days on Market
February
386
$275,000 to $28,500,000
Homes for Sale
46
$325,000 to $3,225,000
January 2024 Sales
$336
Price Per Sq Ft
50
Days on Market
March
399
$275,000 to $28,500,000
Homes for Sale
51
$270,000 to $13,000,000
February 2024 Sales
$297
Price Per Sq Ft
37
Days on Market
April
427
$259,900 to $43M
Homes for Sale
67
$350,000 to $6,400,000
March 2024 Sales
$333
Price Per Sq Ft
45
Days on Market
May
454
$259,900 to $28,500,000
Homes for Sale
89
$275,000 to $7,000,000
April 2024 Sales
$312
Price Per Sq Ft
42
Days on Market
June
428
$100,000 to $28,500,000
Homes for Sale
87
$115,000 to $9,500,000
May 2024 Sales
$306
Price Per Sq Ft
50
Days on Market
July
426
$299,900 to $28,500,000
Homes for Sale
99
$310,000 to $7,000,000
June 2024 Sales
$310
Price Per Sq Ft
37
Days on Market
August
422
$299,900 to $28,500,000
Homes for Sale
55
$245,000 to $6,300,000
July 2024 Sales
$296
Price Per Sq Ft
35
Days on Market
September
445
$299,000 to $28,500,000
Homes for Sale
57
$270,000 to $8,250,000
August 2024 Sales
$299
Price Per Sq Ft
54
Days on Market
October
445
$229,000 to $28,500,000
Homes for Sale
71
$345,000 to $12,500,000
September 2024 Sales
$299
Price Per Sq Ft
46
Days on Market
November
444
$229,000 to $28,500,000
Homes for Sale
74
$309,500 to $5,300,000
October 2024 Sales
$311
Price Per Sq Ft
54
Days on Market
December
450
$275,000 to $28,500,000
Homes for Sale
60
$245,000 to $2,800,000
November 2024 Sales
$303
Price Per Sq Ft
53
Days on Market
January
475
$270,000 to $21,500,000
Homes for Sale
51
$290,000 to $6,040,000
December 2024 Sales
$311
Price Per Sq Ft
50
Days on Market
Information provided by Beaches MLS deemed reliable, but not guaranteed
Wellington Florida Homes for Sale


Wellington Florida
Location: Wellington Florida is centrally located in the western part of Palm Beach County.
Homes: Wellington Florida primarily consists of beautiful single-family homes, but also offers condos, villas, patio homes, townhomes, luxury estate homes, equestrian farms, and multi-family homes.
Year Built: Major construction started in Wellington Florida around the mid-1970s and continues to this day.
Amenities: Wellington Florida is known as the winter equestrian capital of the world, but also offers shopping, dining, and entertainment. Residents also enjoy the local library, parks, and Wellington's weekly events.
Schools: Wellington Florida has top-rated elementary, middle and high schools along with private schools. (Verify school boundaries @ Wellington School Boundaries)
Selling? Find out the value of your Wellington Florida home by calling 561-333-0446 or visiting us online at What's My Home Worth? Once your home value request is received we will provide you with a FREE market analysis via e-mail or with an in-home appointment. Take a sneak peek at just some of the marketing we do to obtain top dollar for your home in the shortest amount of time @ Marketing your home. You can also read what past clients have to say about the service they received by visiting our Testimonial Page.
Buying? If you are looking to purchase a home in Wellington Florida or the surrounding area let us guide you through the home buying process. In order to get started all we need is your home search criteria, which you can provide by calling 561-333-0446 or filling out our Online Buyer Questionnaire. Once received we will do a custom search based on your criteria and e-mail you all of the MLS listings that meet your needs.
Renting? Regardless if you need to list your Wellington Florida home for rent or you want to rent a home in Wellington Florida we can help! If you're a landlord visit our Landlord Resource Center to review our step by step process to listing your home for rent. Here, you will also be able to find out how much your home will rent for, view our tenant screening process, and take a look at just some of the marketing we do to rent your home quickly.
Tenants looking to rent a home in Wellington Florida can receive a list of available homes for rent via e-mail by simply filling out our Online Rental Questionnaire. Learn more about renting a home in Wellington Florida by visiting our Rental Tips and Expectations and review our 9 Steps to Renting a Home.
Contact Realtor Michelle Gibson. @ 561-333-0446 or Contact@WellingtonHomeTeam.com for all your Wellington Florida Real Estate needs.
Previous Detailed Market Reports
Wellington Florida Real Estate Market Report | January 2024
Home inventory in Wellington Florida hasn't changed slightly increased once again. Last month there were 329 homes for sale with asking prices ranging from $284,900 to $27,750,000. Now there are 337 homes for sale with asking prices ranging from $299,000 to $27,750,000.
Back in November, 61 homes sold with sale prices ranging from $312,000 to $10,900,000. While in December 60 homes sold with sale prices ranging from $285,000 to $17,300.
The average DOM (Days on Market) went from 20 days in November up to 23 days in December. While the price per square foot has increased from $302 in November up to $310 in December. Back in November, there were zero distressed sales and there were no distressed sales in December either.
The number of Wellington cash buyers in November was 48% and it was also 48% in December. Conventionally financed buyers went from 42% in November up to 45% in December. FHA homebuyers accounted for 5% in November and decreased down to 3% in December. While VA homebuyers and other sales accounted for 3% in November up to 4% in December.
Wellington Florida Real Estate Market Report | February 2024
Wellington home inventory has increased and home sales have decreased, but historically that is the norm during the holiday months and we are still experiencing a strong sellers market. Last month there were 337 homes for sale with asking prices ranging from $299,000 to $27,750,000. Now there are 386 homes for sale with asking prices ranging from $275,000 up to $28,500,000.
Back in December 60 homes sold with sale prices ranging from $285,000 to $17,300. While in January only 46 homes sold with sale prices ranging from $325,000 to $3,225,000.
The average DOM (Days on Market) went from 23 days in December up to 50 days in January. While the price per square foot has increased from $310 in December up to $336 in January. Back in December, there were zero distressed sales but there was 1 distressed sale in January, it was a bank-owned home.
The number of Wellington cash buyers in December was 48% and increased to 52% in January. Conventionally financed buyers went from 45% in December down to 37% in January. FHA homebuyers accounted for 3% in December and only 2% in January. While VA homebuyers and other sales accounted for 4% in December and increased to 9% in January.
Wellington Florida Real Estate Market Report | March 2024
Wellington home inventory has increased once again, but so have home sales. Last month there were 386 homes for sale with asking prices ranging from $275,000 up to $28,500,000. Now there are 399 homes for sale with the same asking prices, $275,000 up to $28,500,000.
Back in January 46 homes sold with sale prices ranging from $325,000 to $3,225,000. While in February 51 homes sold with sale prices ranging from $270,000 to $13,000,000.
The average DOM (Days on Market) went from 50 days in January and went down to 37 days in February. While the price per square foot has decreased from $336 in January down to $297 in February. Back in January there was only 1 distressed sale, it was a bank-owned home and in February there was also 1 distressed sale, but it was a short sale.
The number of Wellington cash buyers in January was 52% and decreased to 45% in February. Conventionally financed buyers went from 37% in January up to 49% in February. FHA homebuyers accounted for 2% in January and increased to 4% in February. While VA homebuyers and other sales accounted for 9% in January and 2% in February.
Wellington Florida Real Estate Market Report | April 2024
Home inventory in the Village of Wellington continues to increase, however, so has the number of sales. Last month there were 399 homes for sale with the same asking prices, $275,000 up to $28,500,000. Now there are 427 homes for sale with asking prices ranging from $259,900 up to $43,000,000.
Back in February 51 homes sold with sale prices ranging from $270,000 to $13,000,000. While in March 67 homes sold with sale prices ranging from $350,000 to $6,400,000.
The average DOM (Days on Market) went from 37 days in February to 45 days in March. While the price per square foot has increased from $297 in February up to $333 in March. Back in February, there was 1 distressed sale, a short sale and there were no distressed sales in March.
The number of Wellington cash buyers was 45% in February, which increased to 54% in March. Conventionally financed buyers went from 49% in February down to 36% in March. FHA homebuyers accounted for 4% in February and increased to 7% in March. While VA homebuyers and other sales accounted for 2% in February and 5% in March.
Wellington Florida Real Estate Market Report | May 2024
Home inventory in the Village of Wellington continues to increase, however, so has the number of sales. Last month there were 427 homes for sale with asking prices ranging from $259,900 up to $43,000,000. Now there are 454 homes for sale with asking prices ranging from $259,900 to $28,500,000.
Back in March 67 homes sold with sale prices ranging from $350,000 to $6,400,000. While in April 89 homes sold with sale prices ranging from $275,000 to $7,000,000.
The average DOM (Days on Market) went from 45 days in March down to 42 days in April. While the price per square foot has decreased from $333 in March down to $312 in April. Back in March and April there were no distressed sales.
The number of Wellington cash buyers was 54% in March and increased to 56% in April. Conventionally financed buyers went from 36% in March up to 42% in April. FHA homebuyers accounted for 7% in March and 0% in April. While VA homebuyers and other sales accounted for 5% in March and 2% in April.
Wellington Florida Real Estate Market Report | June 2024
Home inventory in the Village of Wellington was on the rise but has dropped back down. Last month there were 454 homes for sale with asking prices ranging from $259,900 to $28,500,000. Now there are 428 homes for sale with asking prices ranging from $100,000 to $28,500,000.
Back in April 89 homes sold with sale prices ranging from $275,000 to $7,000,000. While in May there were 87 homes sold with sale prices ranging from $115,000 to $9,500,000.
The average DOM (Days on Market) went from 42 days in April up to 50 days in May. While the price per square foot has decreased from $312 in April down to $306 in May. Back in both April and May there were no distressed sales.
The number of Wellington cash buyers was 56% in April down to 49% in May. Conventionally financed buyers went from 42% in April up to 47% in May. FHA homebuyers accounted for 0% in April up to 3% in May. While VA homebuyers and other sales accounted for 2% in April down to 1% in May.
Wellington Florida Real Estate Market Report | July 2024
Home inventory in the Village of Wellington has slightly decreased and home sales have increased. Last month there were 428 homes for sale with asking prices ranging from $100,000 to $28,500,000. Now there are 426 homes for sale with asking prices ranging from $299,900 to $28,500,000.
Back in May, there were 87 homes sold with sale prices ranging from $115,000 to $9,500,000. While in June 99 homes sold with sale prices ranging from $310,000 up to $7,000,000.
The average DOM (Days on Market) went from 50 days in May down to 37 days in June. While the price per square foot has increased from $306 in May up to $310 in June. Back in both May and June there were no distressed sales.
The number of Wellington cash buyers was 49% in May down to 43% in June. Conventionally financed buyers went from 47% in May down to 45% in June. FHA homebuyers accounted for 3% in May and 7% in June. While VA homebuyers and other sales accounted for 1% in May and 5% in June.
Wellington Florida Real Estate Market Report | August 2024
Home inventory in the Village of Wellington has slightly decreased and home sales have significantly decreased. Last month there were 426 homes for sale with asking prices ranging from $299,900 to $28,500,000. Now there are 422 homes for sale with asking prices ranging from $299,900 to $28,500,000.
Back in June, 99 homes sold with sale prices ranging from $310,000 up to $7,000,000. While in July 55 homes sold with sale prices ranging from $245,000 to $6,300,000.
The average DOM (Days on Market) went from 37 days in June down to 35 days in July. While the price per square foot has decreased from $310 in June down to $296 in July. Back in both June and July there were no distressed sales.
The number of Wellington cash buyers was 43% in June down to 42% in July. Conventionally financed buyers went from 45% in June down to 38% in July. FHA homebuyers accounted for 7% in June and 11% in July. While VA homebuyers and other sales accounted for 5% in June up to 9% in July.
Wellington Florida Real Estate Market Report | September 2024
Home inventory in the Village of Wellington along with home sales has slightly increased. Last month there were 422 homes for sale with asking prices ranging from $299,900 to $28,500,000. Now there are 445 homes for sale with asking prices ranging from $299,000 to $28,500,000.
Back in July, 55 homes sold with sale prices ranging from $245,000 to $6,300,000. While in August 57 homes sold with sale prices ranging from $270,000 to $8,250,000.
The average DOM (Days on Market) went from 35 days in July up to 54 days in August. While the price per square foot increased from $296 in July up to $299 in August. Back in both July and August there were no distressed sales.
The number of Wellington cash buyers was 42% in July and 37% in August. Conventionally financed buyers went from 38% in July up to 51% in August. FHA homebuyers accounted for 11% in July and only 4% in August. While VA homebuyers and other sales accounted for 9% in July and 8% in August.
Wellington Florida Real Estate Market Report | October 2024
Home inventory in the Village of Wellington remains the same. Last month there were 445 homes for sale with asking prices ranging from $299,000 to $28,500,000. Now there are still 445 homes for sale, but their asking prices range from $229,000 to$28,500,000.
Back in August, 57 homes sold with sale prices ranging from $270,000 to $8,250,000. While in September 71 homes sold with sale prices ranging from $345,000 to $12,500,000.
The average DOM (Days on Market) went from 54 days in August down to 46 days. While the price per square foot remained the same at $299 in August and September. Back in both August and September there were no distressed sales.
The number of Wellington cash buyers was 37% in August and 41% in September. Conventionally financed buyers went from 51% in August down to 48% in September. FHA homebuyers accounted for 4% in August and 5% in September. While VA homebuyers and other sales accounted for 8% in August and 6% in September.
Wellington Florida Real Estate Market Report | November 2024
Home inventory in the Village of Wellington remains the same. Last month there were 445 homes for sale with asking prices ranging from $229,000 to$28,500,000. Now there are 444 homes for sale with the same asking prices, $229,000 to $28,500,000.
Back in September, 71 homes sold with sale prices ranging from $345,000 to $12,500,000. While in October 74 homes sold with sale prices ranging from $309,500 to $5,300,000.
The average DOM (Days on Market) went from 46 days in September up to 54 days in October. While the price per square foot went from $299 in September up to $311 in October. Back in both September and October there were no distressed sales.
The number of Wellington cash buyers was 41% in September and 27% in October, which is extremely low for Wellington. Conventionally financed buyers went from 48% in September up to 61% in October. FHA homebuyers accounted for 5% in September and 9% in October. While VA homebuyers and other sales accounted for 6% in September and 3% in October.
Wellington Florida Real Estate Market Report | December 2024
Home inventory in the Village of Wellington has slightly increased and home sales have decreased, which isn't uncommon this time of year. Last month there were 444 homes for sale with asking prices ranging from $229,000 to $28,500,000. Now there are 450 homes for sale with asking prices ranging from $275,000 to $28,500,000.
Back in October, 74 homes sold with sale prices ranging from $309,500 to $5,300,000. While in November 60 homes sold with sale prices ranging from $245,000 to $2,800,000.
The average DOM (Days on Market) went from 54 days in October to 53 days in November. While the price per square foot went from $311 in October down to $303 in November. Back in both October and November there were no distressed sales.
The number of Wellington cash buyers was 27% in October and 32% in November, which is extremely low for Wellington. Conventionally financed buyers went from 61% in October to 57% in November. FHA homebuyers accounted for 9% in October to 7% in November. VA homebuyers and other sales accounted for 3% in October and 4% in November.